Timing trades in volatile growth stocks is challenging but achievable with the right tools. These stocks experience sharp price swings, often unrelated to company performance, making it critical to rely on technical indicators rather than emotions. Below are the key tools traders use to navigate these unpredictable markets:
- Moving Averages (SMA & EMA): Identify trends and key price levels. Look for crossovers (e.g., 20-day EMA crossing above 50-day SMA) to signal entry or exit points.
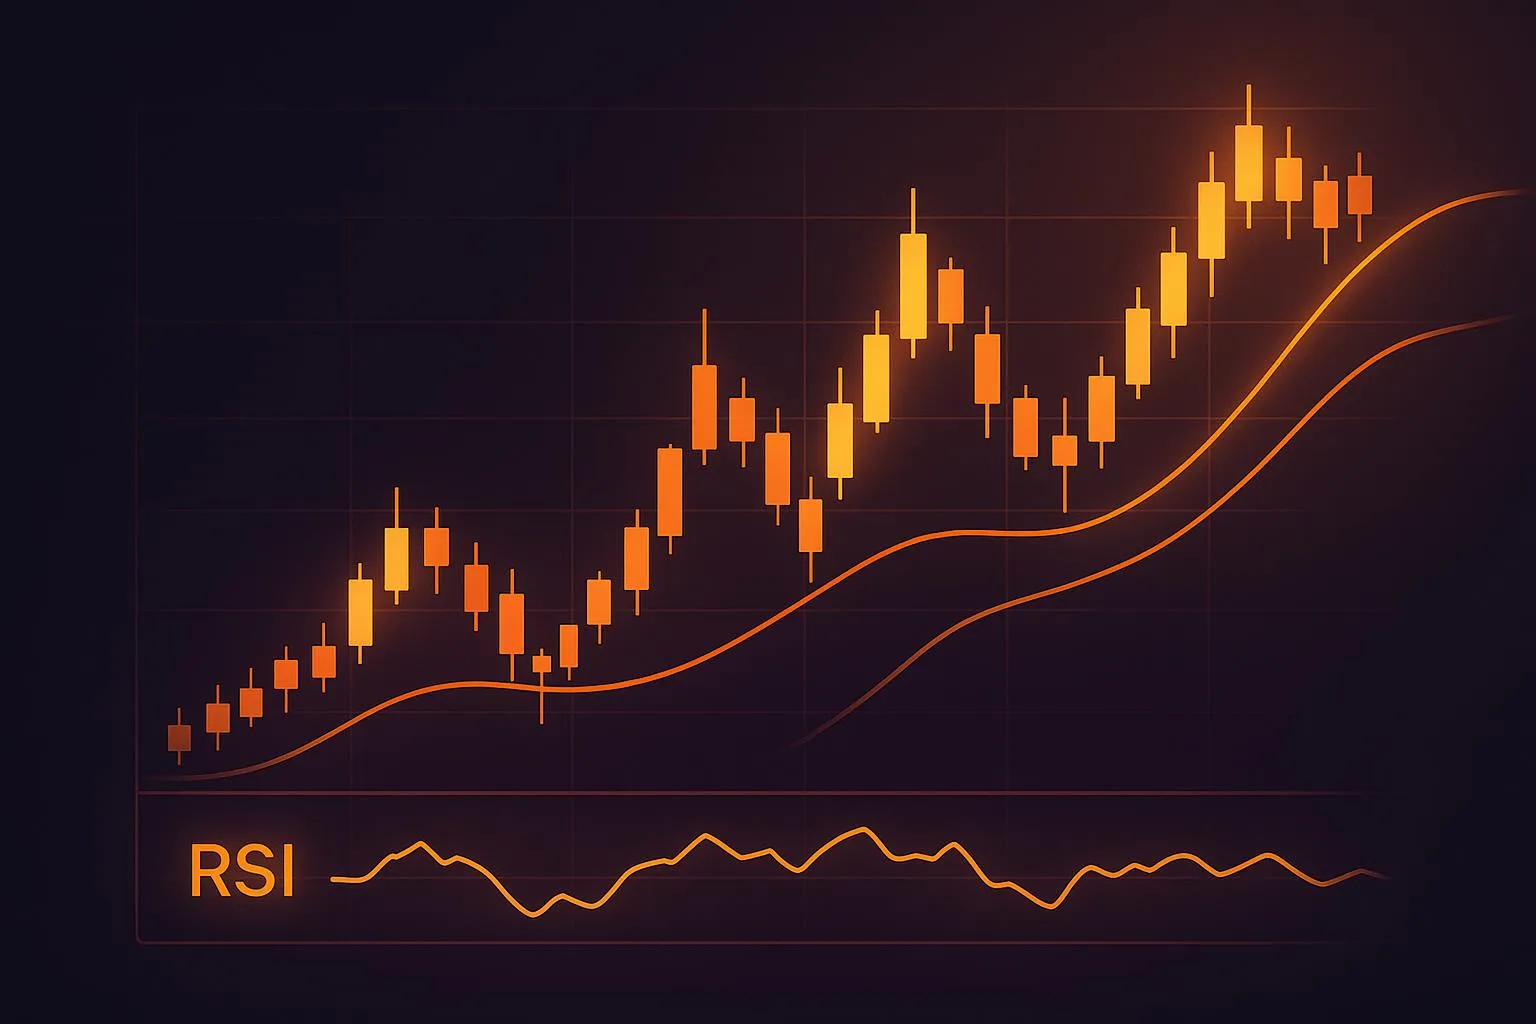
- Relative Strength Index (RSI): Helps spot overbought (above 70 or 80) and oversold (below 30 or 20) conditions. Adjust settings for faster signals in volatile stocks.
- Bollinger Bands: Gauge volatility and potential breakouts. A band squeeze often signals a big move is coming.
- MACD (Moving Average Convergence Divergence): Tracks momentum shifts. Crossovers and histogram changes near the zero line are particularly useful for spotting trend reversals.
- ATR (Average True Range): Measures volatility, helping set stop-loss levels and manage risk.
- Volume Indicators (OBV & VPT): Confirm price moves by analyzing buying or selling strength.
Key Takeaway:
Combining multiple indicators - like RSI with Bollinger Bands or MACD with ATR - provides stronger, more reliable signals. Fine-tune settings to match a stock’s volatility, and consider tools like Mezzi’s AI-driven platform to streamline analysis and receive real-time alerts for better decision-making.
Top Volatility Technical Indicators you should know!!! | #Learn2TradePro | Vivek Bajaj
Key Technical Indicators for Trade Timing
Technical indicators simplify the chaos of market price movements into clear, actionable signals. For traders focusing on volatile growth stocks, mastering these four indicators can provide crucial insights into market trends and help pinpoint trade opportunities.
Moving Averages (SMA and EMA)
Moving averages are powerful tools for identifying trends by smoothing out short-term price fluctuations. The Simple Moving Average (SMA) calculates the average price over a set period, while the Exponential Moving Average (EMA) places greater emphasis on recent prices, making it more sensitive to current market shifts.
For short-term trades, the 20-day EMA is particularly useful. When a stock price moves above this line, it often signals an upward trend. A drop below the 20-day EMA, on the other hand, may indicate growing selling pressure.
For a broader perspective, the 50-day and 200-day SMAs are key. A stock trading above both averages typically shows sustained bullish momentum. The "golden cross", when the 50-day SMA crosses above the 200-day SMA, is a classic signal of potential long-term upward movement.
Crossover events, where a faster moving average intersects a slower one, are critical for spotting entry and exit points in volatile markets. These signals, combined with momentum indicators like the RSI, can enhance timing strategies.
Relative Strength Index (RSI)
The RSI measures momentum by comparing recent gains to losses, generating a value between 0 and 100. This indicator helps traders gauge whether a stock is overbought or oversold.
While the standard RSI thresholds are 70 for overbought and 30 for oversold, volatile growth stocks often demand adjusted levels. Many traders use 80 and 20 as their benchmarks, recognizing that these stocks can sustain momentum longer than others.
Divergence is a key RSI signal: when a stock hits a new high but the RSI does not, it suggests momentum is fading, even if prices are climbing. This bearish divergence often precedes a pullback. For quicker signals, the RSI period can be shortened to 9 from the standard 14, though this may increase the risk of false signals.
Bollinger Bands
Bollinger Bands consist of three lines: a middle line (usually a 20-period SMA) and two outer bands set two standard deviations away from the middle. These bands expand and contract with volatility, making them particularly valuable for trading volatile growth stocks.
A band squeeze - when the bands narrow significantly - signals a period of low volatility that often precedes a sharp price move. If prices begin to move toward one band during a squeeze, it can indicate the start of a strong directional trend.
In range-bound markets, Bollinger Band bounces are effective, as prices tend to oscillate between the upper and lower bands. However, in trending markets, prices may "walk the bands", staying near the upper band during an uptrend or the lower band during a downtrend. The %B indicator, which measures a price’s position relative to the bands, adds another layer of insight. Values above 1.0 indicate an extreme high, while values below 0 suggest an extreme low.
Moving Average Convergence Divergence (MACD)
The MACD combines three elements: the MACD line (calculated as the 12-day EMA minus the 26-day EMA), the signal line (a 9-day EMA of the MACD line), and the histogram (the difference between the MACD and signal lines). Together, these components provide a detailed picture of momentum shifts.
MACD crossovers are particularly telling. When the MACD line crosses above the signal line, it suggests bullish momentum. A downward crossover signals bearish momentum. Crossovers near the zero line are especially meaningful, as they confirm trend changes. For example, when the MACD moves above zero, it means the 12-day EMA has overtaken the 26-day EMA, signaling bullish conditions.
The MACD histogram often acts as an early warning system. If the histogram begins to shrink toward zero, it can indicate that the current trend is losing strength, even if the price trend hasn’t yet reversed. Additionally, MACD divergence - where price peaks are not mirrored by MACD peaks - can warn of potential reversals, a critical cue for traders navigating volatile markets.
Additional Indicators for High Volatility Trading
When trading volatile growth stocks, relying solely on core technical indicators might not cut it. Additional tools like volatility and volume-based indicators can fine-tune trade timing, offering deeper insights into rapid price shifts.
Average True Range (ATR)
ATR stands out because it doesn't focus on price direction but instead measures the range of price movement over a set period, typically 14 days. This makes it a go-to tool for gauging volatility.
For risk management, ATR is invaluable. Traders often set stop-loss levels based on a multiple of the ATR - say, twice the ATR below the entry price. This approach accommodates normal fluctuations while guarding against significant losses. For instance, when ATR values climb, it signals heightened volatility, prompting traders to widen their stop-loss levels or adjust position sizes to manage risk. Conversely, a declining ATR might indicate a market entering a consolidation phase.
Interestingly, very low ATR readings compared to recent levels can act as an early signal that the market may soon experience a surge in volatility. This makes ATR a versatile tool for anticipating potential breakouts or shifts in market behavior.
Volume-Based Indicators (OBV and VPT)
Volume-based indicators provide a layer of context that price movements alone can't offer. They reveal the strength - or lack thereof - behind trends, making them especially useful in volatile conditions. Two key tools here are On-Balance Volume (OBV) and Volume Price Trend (VPT).
On-Balance Volume (OBV) tracks cumulative volume by adding it on days when prices rise and subtracting it on days when prices fall. If prices hit new highs but OBV remains flat, it could indicate weak buying support, potentially signaling an impending reversal. On the flip side, a rising OBV during price consolidation might suggest that savvy investors are quietly accumulating shares, hinting at a possible breakout.
Volume Price Trend (VPT) takes this a step further by weighting volume according to the percentage change in price. This makes it particularly effective in volatile markets. Sharp volume spikes often confirm price moves, especially during breakouts. Gradual increases in VPT, however, might suggest momentum is building for a longer-term trend continuation.
Volume-based indicators are especially critical during key events like earnings announcements or major news releases. For example, if a stock sees a sharp price jump on good news but volume indicators like OBV or VPT suggest distribution rather than strong accumulation, the rally may not hold. Conversely, strong volume support during a price advance can indicate the move is more likely to sustain.
sbb-itb-e429e5c
Using Multiple Indicators for Better Trade Timing
Relying on a single indicator can often lead to misleading signals, especially when dealing with volatile stocks. By combining multiple tools, traders can gain a clearer and more reliable view of the market.
Combining 2 or More Indicators
Pairing complementary indicators can help create stronger, more reliable signals. When two or more tools align in their predictions, the resulting signal is often more trustworthy than one generated by a single indicator alone.
For instance, an RSI dropping below 30 combined with the price touching the lower Bollinger Band may suggest a buying opportunity. Similarly, a bullish MACD crossover paired with rising ATR values could indicate the start of a new trend. To strengthen these signals further, traders can confirm them using volume indicators, which help validate the momentum behind price movements. This approach reduces the likelihood of acting on false positives that might occur when using just one indicator.
Timing is everything here. Waiting for signals from multiple indicators to align can help traders avoid jumping into trades prematurely or based on incomplete information.
Adjusting Indicator Settings
Once you've combined indicators, it's crucial to fine-tune their settings to match the stock's volatility. Default settings are designed for average market conditions, but volatile growth stocks often require more specific adjustments to capture their unique price behaviors.
Take the RSI, for example. While the standard 14-period RSI works for many stocks, reducing it to 9 or 11 periods can make it more responsive to rapid price changes in volatile stocks. Similarly, the length of moving averages should reflect the stock’s typical price cycle. Stocks with frequent swings may perform better with shorter moving averages.
For Bollinger Bands, increasing the standard deviation to 2.5–3.0 can help filter out false breakout signals in highly volatile scenarios. Adjustments can also be made to MACD settings by tweaking the fast and slow EMA periods, allowing the indicator to react more quickly to sudden price movements while managing the risk of overtrading.
The best way to ensure these adjustments work is through backtesting. Test different configurations on historical data for the specific stocks you trade. Remember, what works for one stock may not be effective for another.
Using Mezzi's AI-Driven Insights
For traders looking to simplify this process, Mezzi's platform offers automated solutions that streamline indicator analysis. By synthesizing data from multiple technical indicators, Mezzi delivers actionable insights tailored to self-directed investors.
The platform’s AI can analyze numerous indicators simultaneously, identifying alignment patterns that would otherwise take hours of manual charting to uncover. Real-time alerts notify users when multiple indicators align, flagging potential trade opportunities without the need to constantly monitor charts across various timeframes.
Additionally, Mezzi’s AI chat feature allows users to ask specific questions about indicator combinations for their holdings. The responses are based on historical data and current technical conditions, providing immediate, data-backed guidance.
Mezzi also supports better risk management through its risk discovery tool, which identifies high-risk scenarios. This feature helps traders make timely adjustments to position sizes or exit trades altogether, ultimately aiding in smarter decision-making.
Conclusion: Timing Trades in Volatile Markets
Trading volatile growth stocks demands a methodical approach that leans on technical indicators to guide decisions. Tools like moving averages, RSI, Bollinger Bands, and MACD each bring their own strengths in spotting market momentum and potential turning points.
The key lies in combining multiple indicators rather than depending on just one. For instance, pairing RSI signals with Bollinger Band touches or confirming MACD crossovers with volume indicators can lead to more reliable entry and exit strategies. This layered approach minimizes the risk of acting on false signals, which are common in volatile markets.
Tailoring your indicators is just as important. Default settings might work for average conditions, but volatile stocks often require adjustments - like tweaking RSI periods, Bollinger Band deviations, or moving average lengths - to better align with market behavior. Applying these tools across different timeframes also helps capture volatility patterns, giving you the flexibility to match your trading style, investment horizon, and risk tolerance.
Risk management should always be a priority. Use indicators to set dynamic stop-loss levels and profit targets that adjust to market shifts. This strategy ensures you can seize opportunities while safeguarding your capital from abrupt reversals.
To simplify this process, Mezzi's AI-driven platform automates indicator analysis, combining multiple technical tools to identify alignment patterns. It delivers real-time alerts for trading opportunities, freeing you from hours of manual chart analysis and allowing you to focus on execution.
FAQs
What are the best ways to combine technical indicators for timing trades in volatile growth stocks?
To sharpen your timing when trading volatile growth stocks, it’s smart to pair trend-following indicators with momentum-based tools for a more balanced approach. For example, leverage moving averages or the MACD to confirm the stock’s broader trend direction. Then, bring in momentum indicators like the RSI to identify overbought or oversold levels, which can hint at possible entry or exit points.
Another useful tool is Bollinger Bands, which highlight periods of heightened volatility. When the bands widen, it typically signals increased price swings, while a price crossing the upper or lower band can point to potential reversals. Combining these indicators helps you cut through market noise, reducing false signals and enabling more confident, data-backed decisions - even in unpredictable conditions.
How can I adjust technical indicators to better handle the volatility of growth stocks?
When dealing with the high volatility of growth stocks, tweaking technical indicators to make them more responsive can be a game-changer. For instance, switching to a 10-day moving average instead of the standard 20-day can help you track rapid price changes more effectively. Similarly, shortening the RSI (Relative Strength Index) look-back period from 14 to 7 makes it easier to detect overbought or oversold conditions in fast-moving markets.
If you’re using Bollinger Bands, consider lowering the standard deviation multiplier from 2 to 1.5. This adjustment allows the bands to react more quickly to price swings, providing earlier signals for potential entry and exit points. These small changes can help traders stay ahead in volatile environments, making decisions with greater speed and confidence.
How can AI-powered platforms like Mezzi improve the use of technical indicators for trading in volatile growth stocks?
AI-powered platforms such as Mezzi streamline the task of analyzing technical indicators by automating intricate calculations and delivering real-time insights. These tools can automatically adapt indicators like moving averages, RSI, or Bollinger Bands to reflect current market conditions, helping traders pinpoint the best entry and exit points with greater ease.
By using advanced data processing and pattern recognition, Mezzi cuts down the time needed for manual analysis and boosts accuracy, especially during periods of high market volatility. This enables traders to make quicker, data-backed decisions, even in unpredictable and fast-changing markets.
Related Blog Posts
Table of Contents
Book Free Consultation
Walk through Mezzi with our team, review your current situation, and ask any questions you may have.